
CT perfusion in ischemic stroke
Updates to Article Attributes
CT perfusion in ischaemic stroke has become established in most centres with stroke services as an important adjunct, along with CT angiography (CTA), to conventional unenhanced CT brain imaging.
It enables differentiation of salvageable ischaemic brain tissue (the penumbra) from the irrevocably damaged infarcted brain (the infarct core). This is useful when assessing a patient for treatment (thrombolysis or clot retrieval).
Although MRI is more sensitive to the early parenchymal changes of infarction (see DWI in acute stroke) its clinical application has been limited by difficulties in accessing MRI in a timely fashion in many institutions; this is especially important in this clinical setting as rapid imaging and treatment are crucial to successful intervention.
Radiographic features
The key to interpreting CT perfusion in the setting of acute ischaemic stroke is understanding and identifying the infarct core and the ischaemic penumbra, as a patient with a small core and a large penumbra is most likely to benefit from reperfusion therapies.
The three parameters typically used in determining these two areas are:
- mean transit time (MTT) or time to peak (TTP) of the deconvolved tissue residue function (Tmax) 3
- cerebral blood flow (CBF)
- cerebral blood volume (CBV)
These three parameters are related to each over according to the central volume principle: CBF = CBV/MTT 7
Normal perfusion parameters are:
- gray matter
- MTT: 4 s
- CBF: 60 mL/100 g/min
- CBV: 4 mL/100 g
- white matter
- MTT: 4.8 s
- CBF: 25 mL/100 g/min
- CBV: 2 mL/100 g
The infarct core is the part of the ischaemic brain which has already infarcted or is destined to infarct regardless of therapy. It is defined as an area with prolonged MTT or Tmax, markedly decreased CBF and markedly reduced CBV 1-3 (see figure 34). Note, that if one uses CBF alone to visually assess core size, it is easy to overestimate infarct core, as the penumbra often has reduced CBF also. So, even though some automated processes used CBF to define the core, CBV is a safer parameter if 'eye-balling' the scan.
The ischaemic penumbra, which in most cases surrounds the infarct core, also has prolonged MTT or Tmax but in contrast, has only moderately reduced CBF and, importantly, near-normal or even increased CBV (due to autoregulatory vasodilatation) 1-3 (see figure 23).
Practical points
In patients with poor cardiac output, atrial fibrillation, severe proximal arterial stenosis or poor placement of arterial and venous density regions of interest, the decreased blood flow can lead to inaccurate perfusion maps and specifically to overestimated MTT (i.e. erroneous diagnosis of extensive ischaemia or global hypoperfusion) and underestimated CBF.
Most CT perfusion protocols are centred upon the basal ganglia and supra-ganglionic level. This excludes a large volume of the brain, e.g. the posterior fossa and superior cerebral hemispheres.
Small infarcts (e.g. lacunar infarcts) are poorly visualised on perfusion maps due to their low resolution.
In cases of seizures, the ictal region shows hyperperfusion, which may lead to an interpretation of hypoperfusion in the contralateral hemisphere mimicking infarct.
Summary
The CBV, and to a lesser extent CBF, differentiates penumbra and core infarct:
- core
- increased MTT/Tmax
- markedly decreased CBF
- markedly decreased CBV
- penumbra
- increased MTT/Tmax
- moderately reduced CBF
- near-normal or increased CBV
-</ol><p>These three parameters are related to each over according to the <a title="central volume principle" href="/articles/central-volume-principle">central volume principle</a>: CBF = CBV/MTT <sup>7</sup></p><p>Normal perfusion parameters are:</p><ul>- +</ol><p>These three parameters are related to each over according to the <a href="/articles/central-volume-principle">central volume principle</a>: CBF = CBV/MTT <sup>7</sup></p><p>Normal perfusion parameters are:</p><ul>
-</ul><p>The <a href="/articles/infarct-core">infarct core</a> is the part of the ischaemic brain which has already infarcted or is destined to infarct regardless of therapy. It is defined as an area with prolonged MTT or Tmax, markedly decreased CBF and markedly reduced CBV <sup>1-3</sup> (see figure 3). Note, that if one uses CBF alone to visually assess core size, it is easy to overestimate infarct core, as the penumbra often has reduced CBF also. So, even though some automated processes used CBF to define the core, CBV is a safer parameter if 'eye-balling' the scan.</p><p>The <a href="/articles/ischaemic-penumbra">ischaemic penumbra</a>, which in most cases surrounds the infarct core, also has prolonged MTT or Tmax but in contrast, has only moderately reduced CBF and, importantly, near-normal or even increased CBV (due to autoregulatory vasodilatation) <sup>1-3 </sup>(see figure 2).</p><h4>Practical points</h4><p>In patients with poor cardiac output, atrial fibrillation, severe proximal arterial stenosis or poor placement of arterial and venous density regions of interest, the decreased blood flow can lead to inaccurate perfusion maps and specifically to overestimated MTT (i.e. erroneous diagnosis of extensive ischaemia or global hypoperfusion) and underestimated CBF.</p><p>Most CT perfusion protocols are centred upon the basal ganglia and supra-ganglionic level. This excludes a large volume of the brain, e.g. the posterior fossa and superior cerebral hemispheres.</p><p>Small infarcts (e.g. <a href="/articles/lacunar-infarct">lacunar infarcts</a>) are poorly visualised on perfusion maps due to their low resolution.</p><p>In cases of seizures, the ictal region shows hyperperfusion, which may lead to an interpretation of hypoperfusion in the contralateral hemisphere mimicking infarct.</p><h4>Summary</h4><p>The CBV, and to a lesser extent CBF, differentiates penumbra and core infarct:</p><ul>- +</ul><p>The <a href="/articles/infarct-core">infarct core</a> is the part of the ischaemic brain which has already infarcted or is destined to infarct regardless of therapy. It is defined as an area with prolonged MTT or Tmax, markedly decreased CBF and markedly reduced CBV <sup>1-3</sup> (see figure 4). Note, that if one uses CBF alone to visually assess core size, it is easy to overestimate infarct core, as the penumbra often has reduced CBF also. So, even though some automated processes used CBF to define the core, CBV is a safer parameter if 'eye-balling' the scan.</p><p>The <a href="/articles/ischaemic-penumbra">ischaemic penumbra</a>, which in most cases surrounds the infarct core, also has prolonged MTT or Tmax but in contrast, has only moderately reduced CBF and, importantly, near-normal or even increased CBV (due to autoregulatory vasodilatation) <sup>1-3 </sup>(see figure 3).</p><h4>Practical points</h4><p>In patients with poor cardiac output, atrial fibrillation, severe proximal arterial stenosis or poor placement of arterial and venous density regions of interest, the decreased blood flow can lead to inaccurate perfusion maps and specifically to overestimated MTT (i.e. erroneous diagnosis of extensive ischaemia or global hypoperfusion) and underestimated CBF.</p><p>Most CT perfusion protocols are centred upon the basal ganglia and supra-ganglionic level. This excludes a large volume of the brain, e.g. the posterior fossa and superior cerebral hemispheres.</p><p>Small infarcts (e.g. <a href="/articles/lacunar-infarct">lacunar infarcts</a>) are poorly visualised on perfusion maps due to their low resolution.</p><p>In cases of seizures, the ictal region shows hyperperfusion, which may lead to an interpretation of hypoperfusion in the contralateral hemisphere mimicking infarct.</p><h4>Summary</h4><p>The CBV, and to a lesser extent CBF, differentiates penumbra and core infarct:</p><ul>
Image 1 Diagram ( create )
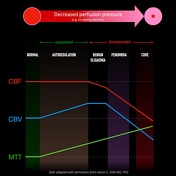
Image 2 Diagram (Parameters) ( update )

Image 3 Annotated image (Ischaemic penumbra) ( update )

Image 4 Annotated image (Core infarct) ( update )

Image 5 CT (RAPID calculations) ( update )

Image 6 CT (CBV) ( update )

Image 7 CT (Perfusion) ( update )

Image 8 CT (MTT) ( update )

Image 9 CT (non-contrast thins) ( update )

Image 10 CT (MTT) ( update )

Image 11 CT (MTT) ( update )

Image 12 CT (CT perfusion) ( update )

Image 13 CT (Tmax) ( update )
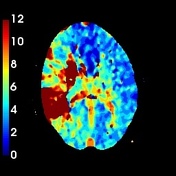
Image 14 CT (TTP) ( update )

Image 15 CT (TTD) ( update )

Image 16 CT (TTD) ( update )


 Unable to process the form. Check for errors and try again.